



Dashboard
The dashboard shows you, on one page, a graphical presentation of your job profiles (including requirements [TARGET] and current assessment [ACTUAL]) and a bar chart overview of your completed, planned, or open measures.
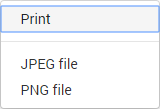
You can save the displayed charts as an image on your PC using a button ( ).
).
Each chart always shows you a presentation based on the current values.
My Qualification Overview
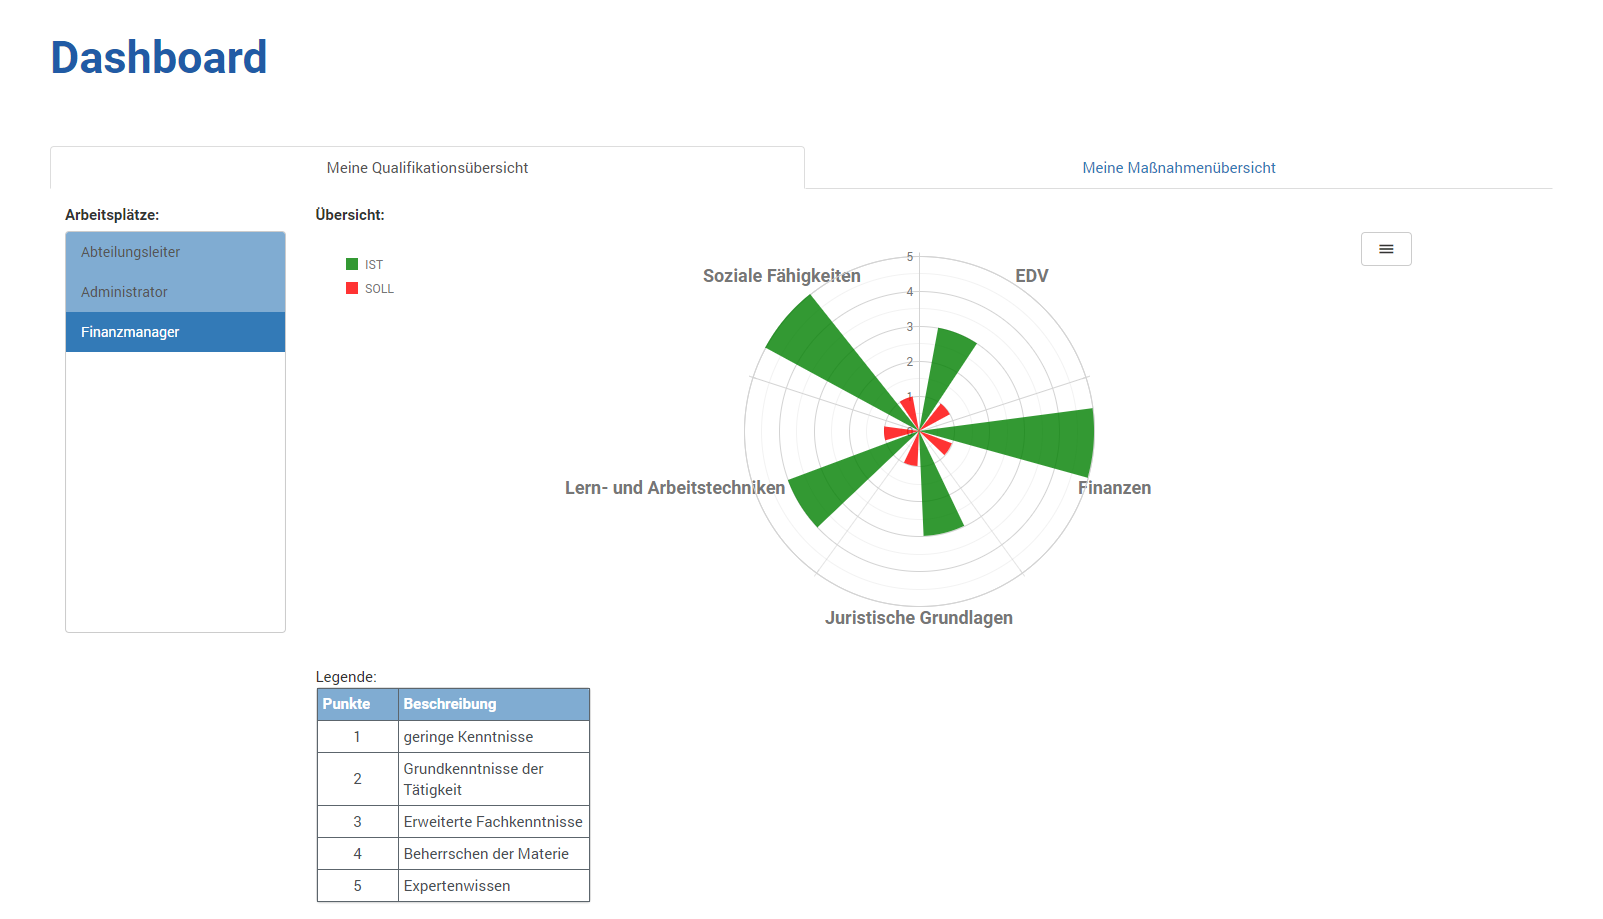
The basis is the individual qualification matrix, which is used for the chart.
For this example, the following individual qualification matrix forms the basis for the calculation and presentation:
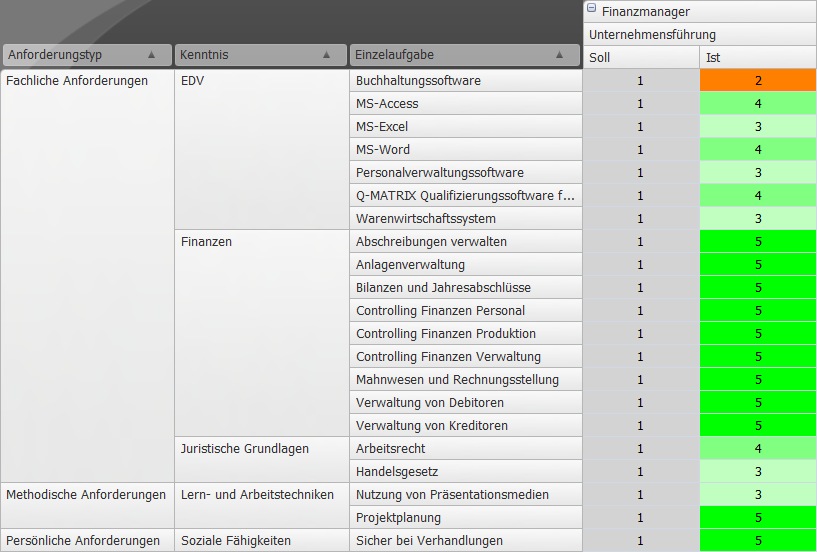
The chart thus shows you, per skill, the integer average values for the TARGET and ACTUAL values.
The legend is based on the qualification levels set in your company and is intended to help you correctly interpret the numeric values.
If you are assigned to multiple workplaces / positions, you can display this chart for each of your positions.
To do this, select the desired one in the list of your workplaces / positions by clicking it with the left mouse button.
The currently displayed position is shown highlighted in dark blue in the list.
My Measures Overview
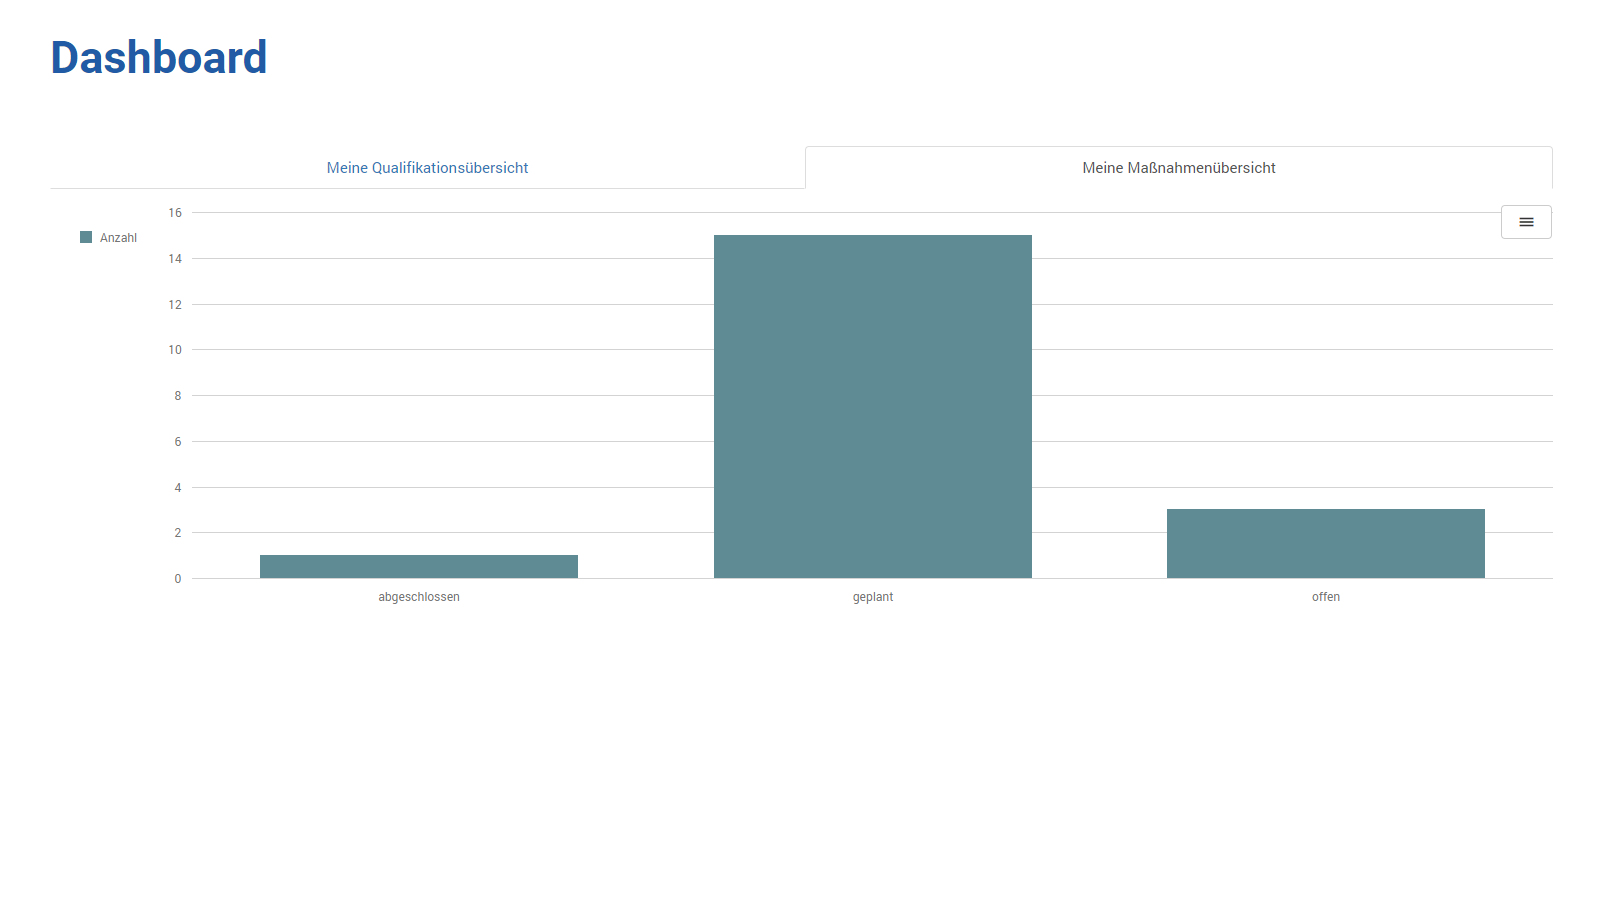
The bars shown are based on the information stored by your company and show you how many measures you have already completed, how many measures are still being planned for you (scheduled for a specific date), and how many measures are still open (not scheduled).