



Menu Item "Qualification Overview"
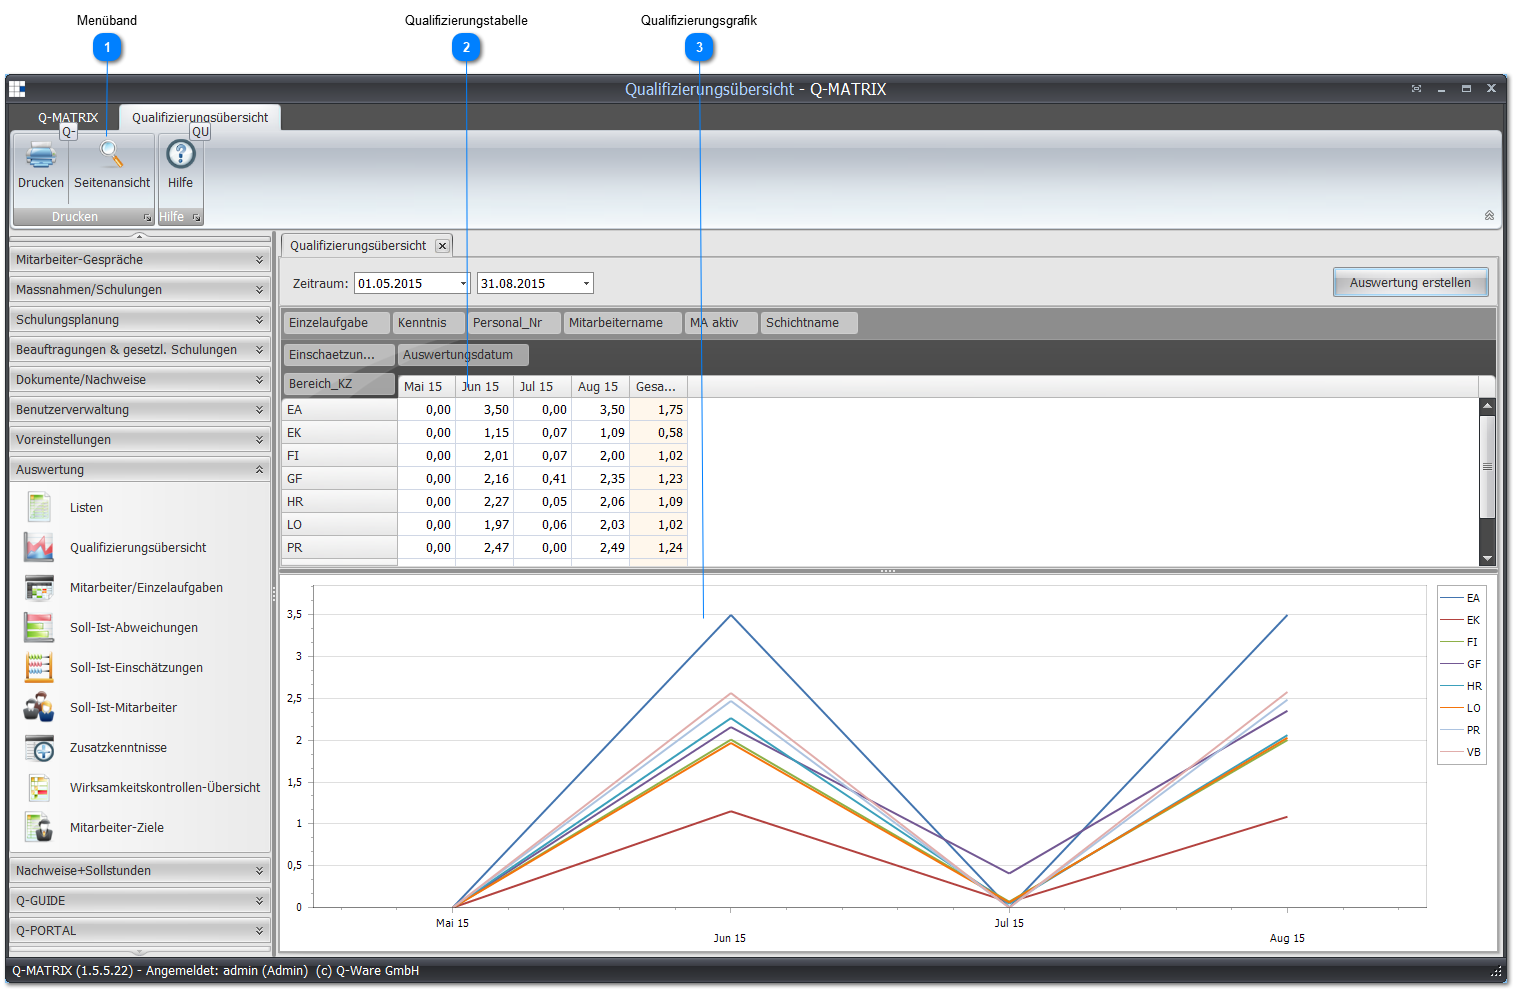
The qualification overview serves to overview and analyze employee/department/area development in your company.
 Ribbon
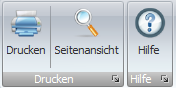
Print Preview opens the graph as a print-ready document.
 Qualification Table

Set a period you want to view, and apply the filter with Update Evaluation.
The number of underlying records is displayed in an information window for informational purposes only.
You can now track the development of your employees over the selected period by viewing the overall ratings for each month in a table.
An average value of the ratings for this period is also calculated.
 Qualification Chart
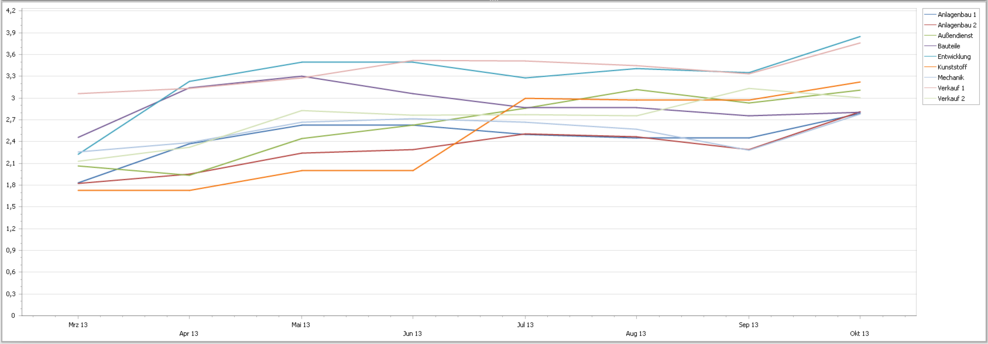
A graph matching the table is displayed here. You will find the legend to the right of the graph.
The X-axis of the coordinate system always shows the selected period, and the Y-axis always shows the rating scale.
You can change the displayed data according to the settings.